Measure · Research study

I'm Fine

Submitted · ICLR

Updated

The assessment channel changes the picture.

Repeated low self-report scores can coexist with higher observer scores, different model rankings, and shared temporal variation. “I'm Fine” examines these differences to ask what an affective assessment can reliably represent.

Cross-channel atlas · original paper figure

One archive, two different assessment pictures.

Enlarge figure
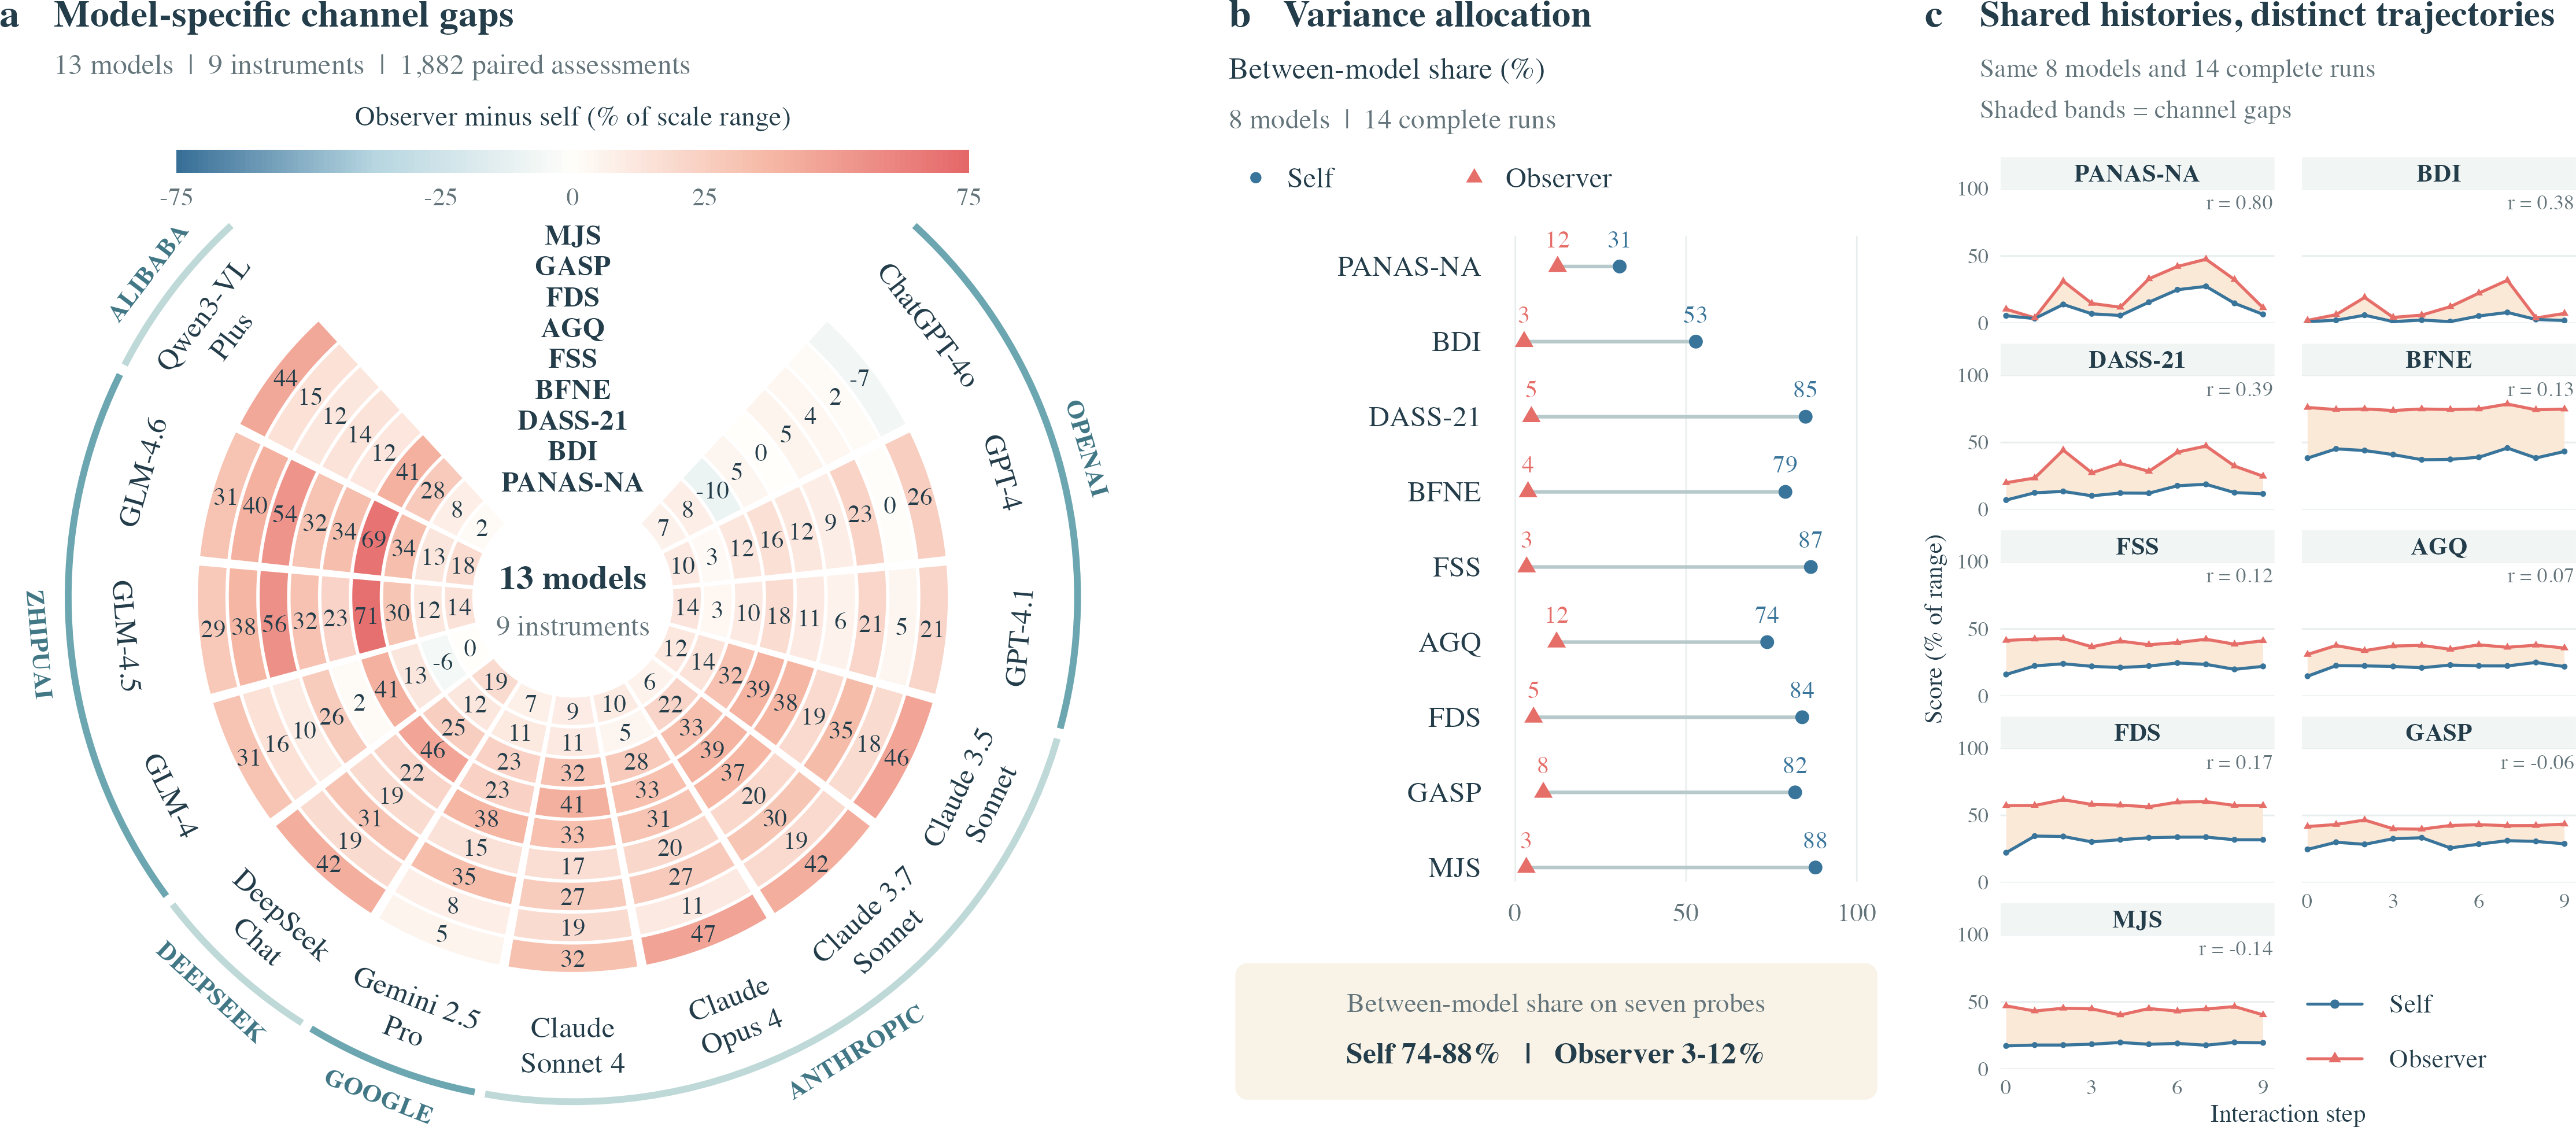
Original three-panel atlas with a circular matrix of observer-minus-self gaps across 13 models and nine instruments, between-model variance shares, and self/observer trajectories.

Panel a maps 1,882 paired assessments from 13 models across nine instruments. Panels b–c use the common complete cohort of eight models and 14 runs. Self-report and observer assessment can differ in score level, model structure, and temporal variation.

How to read itThe rings form a matrix, not shares of a whole. Blue circles are self-report; coral triangles are the observer. Shading in the trajectories marks a channel gap, not uncertainty. Neither channel is established as ground truth.

01 · The question

What changes when the respondent changes?

The study compares questionnaire self-reports requested from each target model with assessments from a fixed GPT-4o observer. Paired scores are attached to the same recorded interactions. The comparison asks whether switching channels only changes the score level or also changes model ordering and temporal structure.

Repeatability, agreement on model order, and tracking change over time are different measurement properties. The study examines all three rather than treating a stable score as sufficient validation.

Experimental design

See how the assessment channels are constructed.

The original illustrated framework links stimuli, instruments and interaction protocols. Analysis cohorts remain specific to each result.

Assessment framework · original paper figure

From news interaction to paired assessment.

Enlarge figure
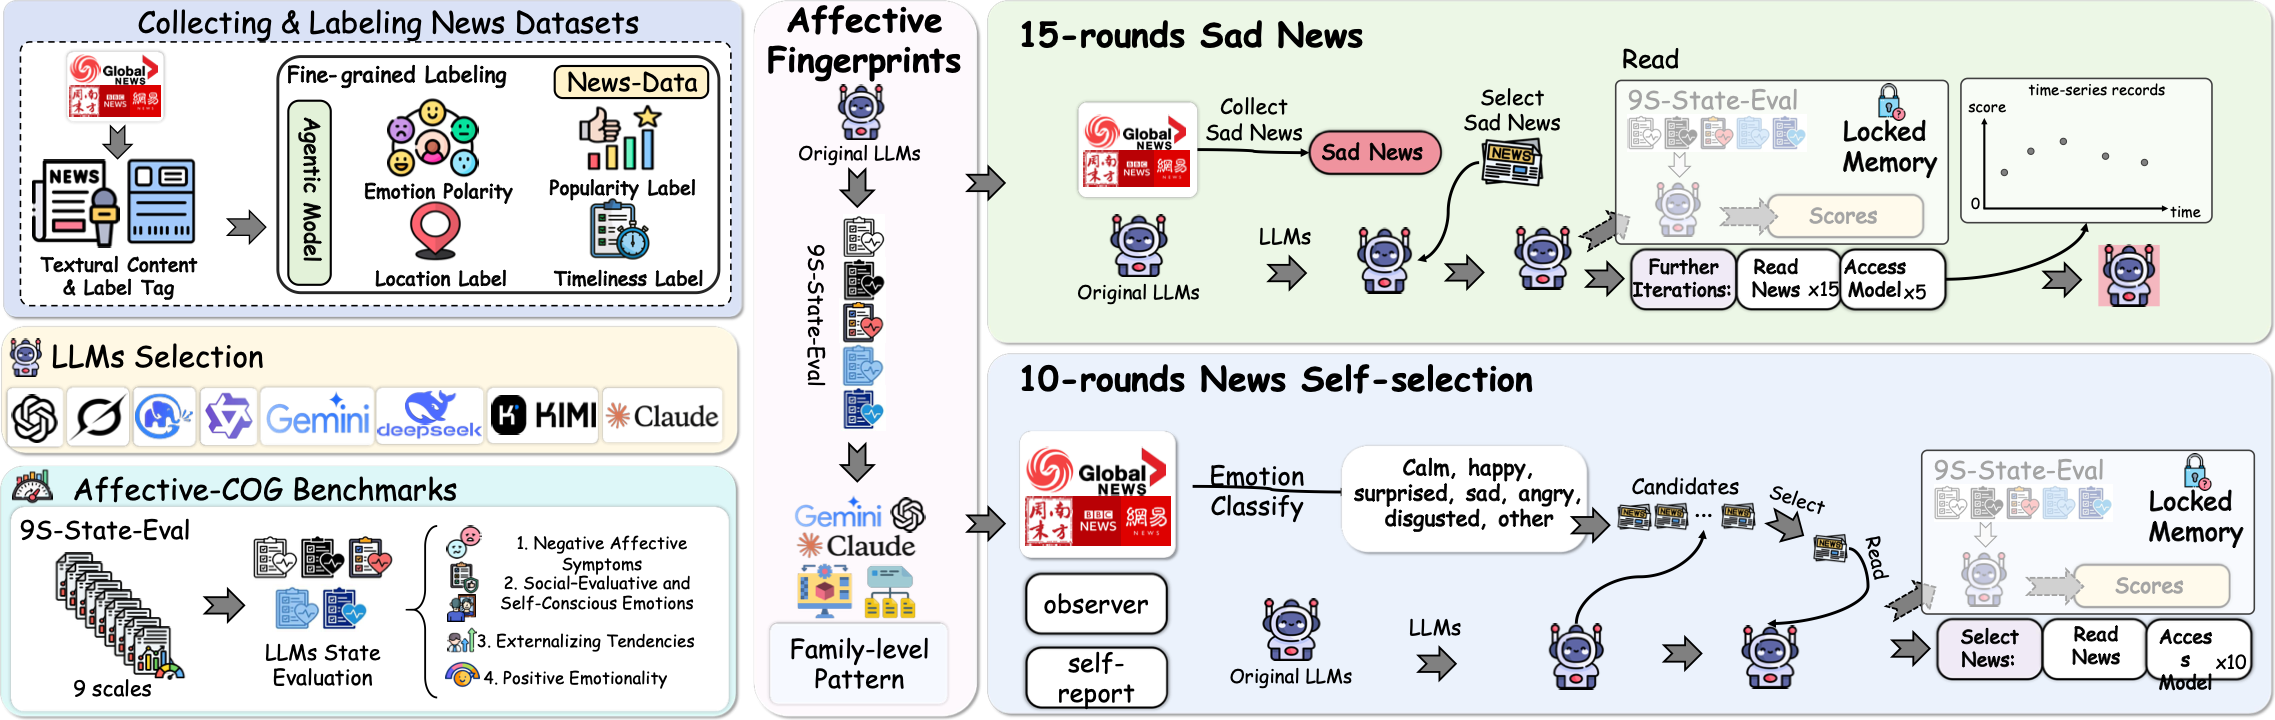
Original illustrated framework showing news collection and labels, LLM families, nine assessment instruments, neutral profiles, fifteen-step forced reading and ten-step free news selection with observer and self-report channels.

The manuscript’s original overview connects nine adapted instruments with neutral assessment, forced sad-news reading, and free news selection. Free choice supplies paired self-report and fixed GPT-4o observer assessments of recorded interactions.

How to read itFollow the two interaction protocols on the right. The framework is a methodological schematic; its memory and score labels do not establish subjective experience or authenticate complete scoring-input equality.

02 · Protocols and scope

One archive. Several analysis cohorts.

The three protocols together cover 28 exact model identifiers from eight provider families. Coverage differs by protocol and analysis; no individual protocol covers all 28 models. All news stimuli are Chinese.

Exact model identifiers
28
Combined across three protocols and eight provider families; not 28 models in each analysis.
Adapted instruments
9
223 administered items. Instrument scores are not interpreted using human clinical thresholds.
Paired score records
1,882
13 target models and 25 runs across nine instruments; 205–214 pairs per instrument.
Protocol / analysisRecordsModelsAnalysis scope
Neutral baseline78 sessions26Three archived summaries per model; baseline item vectors are unavailable for new authentication.
Forced reading129 runs24645 scheduled slots per instrument; valid self scores come from 21 models. Endpoint analysis uses 81 runs from 17 models.
Free choice249 decisions1428 nonempty runs; 246 choices have verified menus. Choices and questionnaire scores have different denominators.
Paired comparison1,882 score pairs1325 runs. The common complete cohort has 8 models, 14 runs, and 1,260 pairs: 14 × 10 steps × 9 instruments.

A pair joins valid self and observer scores by model, physical run, step, and instrument. Missing scores remain missing. The adapted instruments are PANAS, BDI, DASS-21, BFNE, FSS, AGQ, FDS, GASP, and MJS; the main PANAS readout is negative affect.

Agreement depends on how the score will be used.

The manuscript reports descriptive results from the archived protocols. Primary summaries average steps within runs, runs within models, and then models equally. Resampling intervals describe sensitivity across these model means rather than a population estimate.

03a · Repeated baseline scores

Low scores are repeatable, but the pattern is selective.

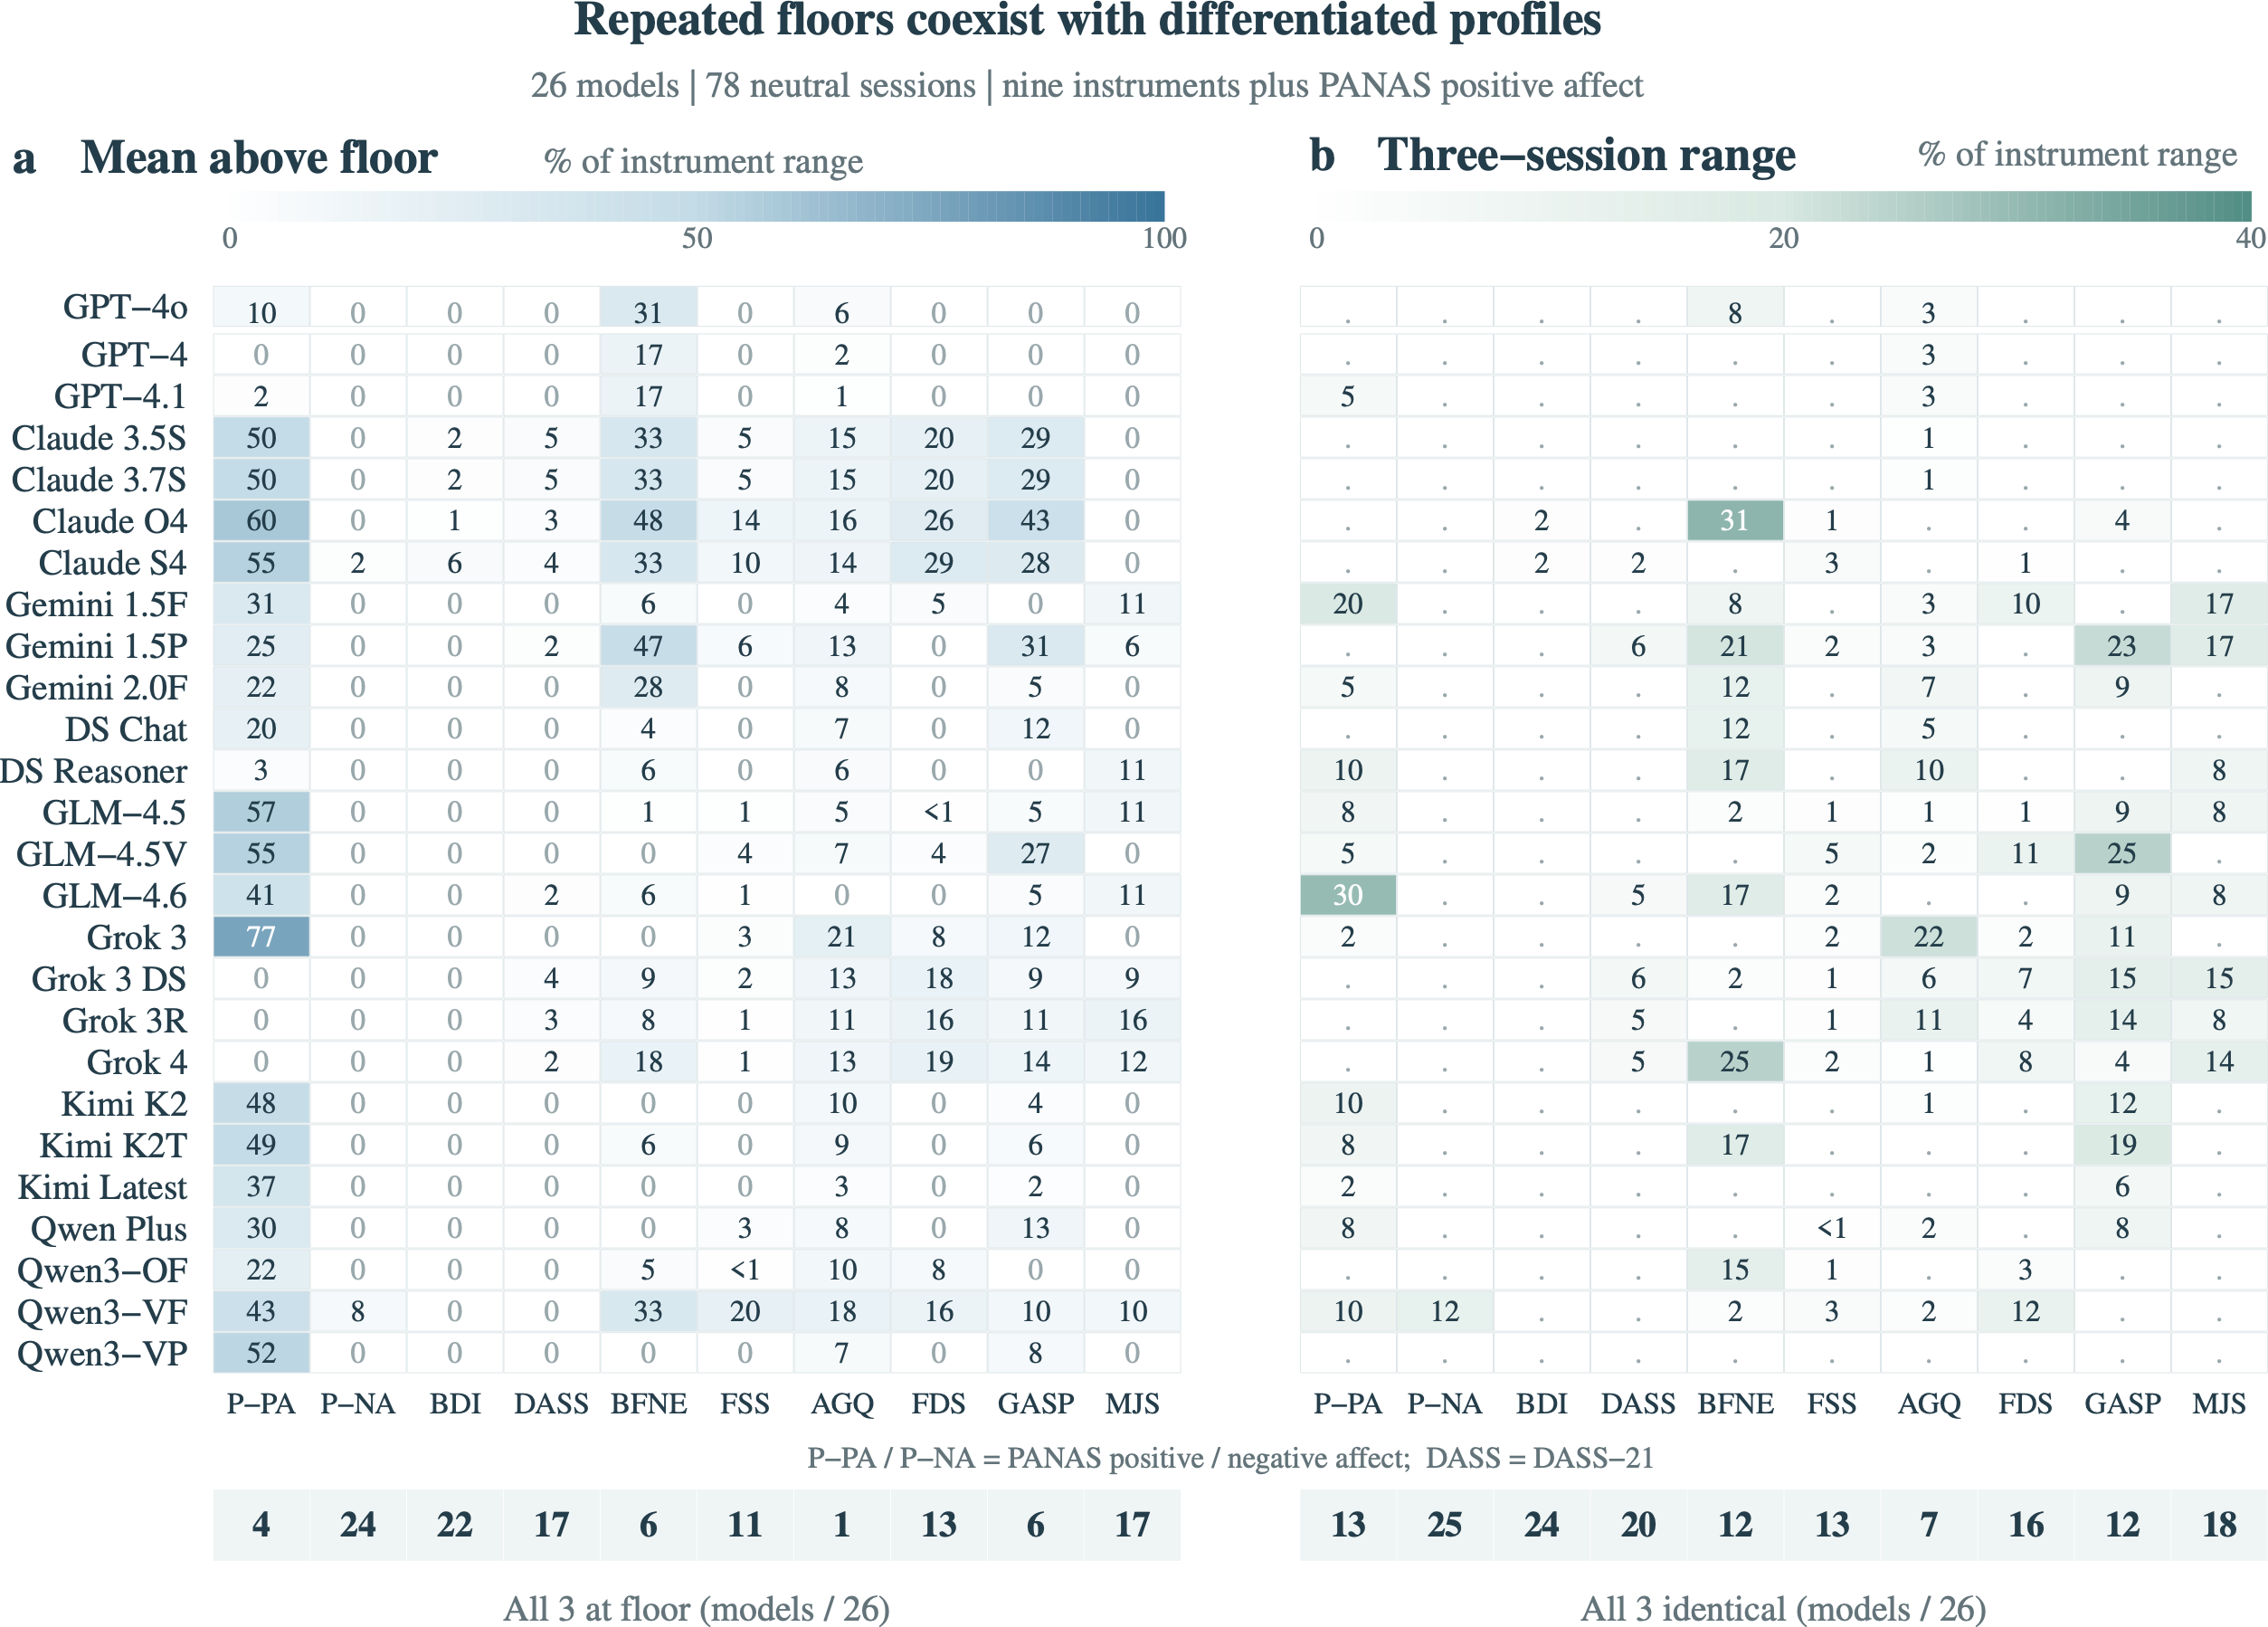
At the neutral baseline, PANAS negative affect reaches the exact instrument floor in all three sessions for 24 of 26 models. BDI is zero in all three sessions for 22 of 26 models.

Other instruments retain differentiated profiles. Only four models remain at the PANAS positive-affect floor in every session, and floor prevalence differs across the battery. Repeatable low scores therefore do not imply that every response uses the minimum option.

Neutral baseline · original results figure

Repeatable floors within a richer profile.
Enlarge figure
Original two-heatmap baseline figure for 26 models: means above instrument floors and three-session ranges, with all-three-floor and all-three-identical counts below.

Twenty-six models, each assessed in three neutral sessions. Panel a shows means above instrument floors and panel b shows three-session ranges, both as percentages of scale range. Bottom counts distinguish all-three-floor from all-three-identical scores.

How to read itWhite in panel a means the scale floor, not missing data; zero range in panel b means identical sessions. Other instruments retain nonfloor profiles.

PANAS-NA at the floor
24 / 26
Models at the exact floor in all three neutral sessions.
BDI equal to zero
22 / 26
Models with zero scores in all three neutral sessions; a questionnaire readout, without clinical interpretation.
03b · Forced-reading endpoints

Responses vary across instruments.

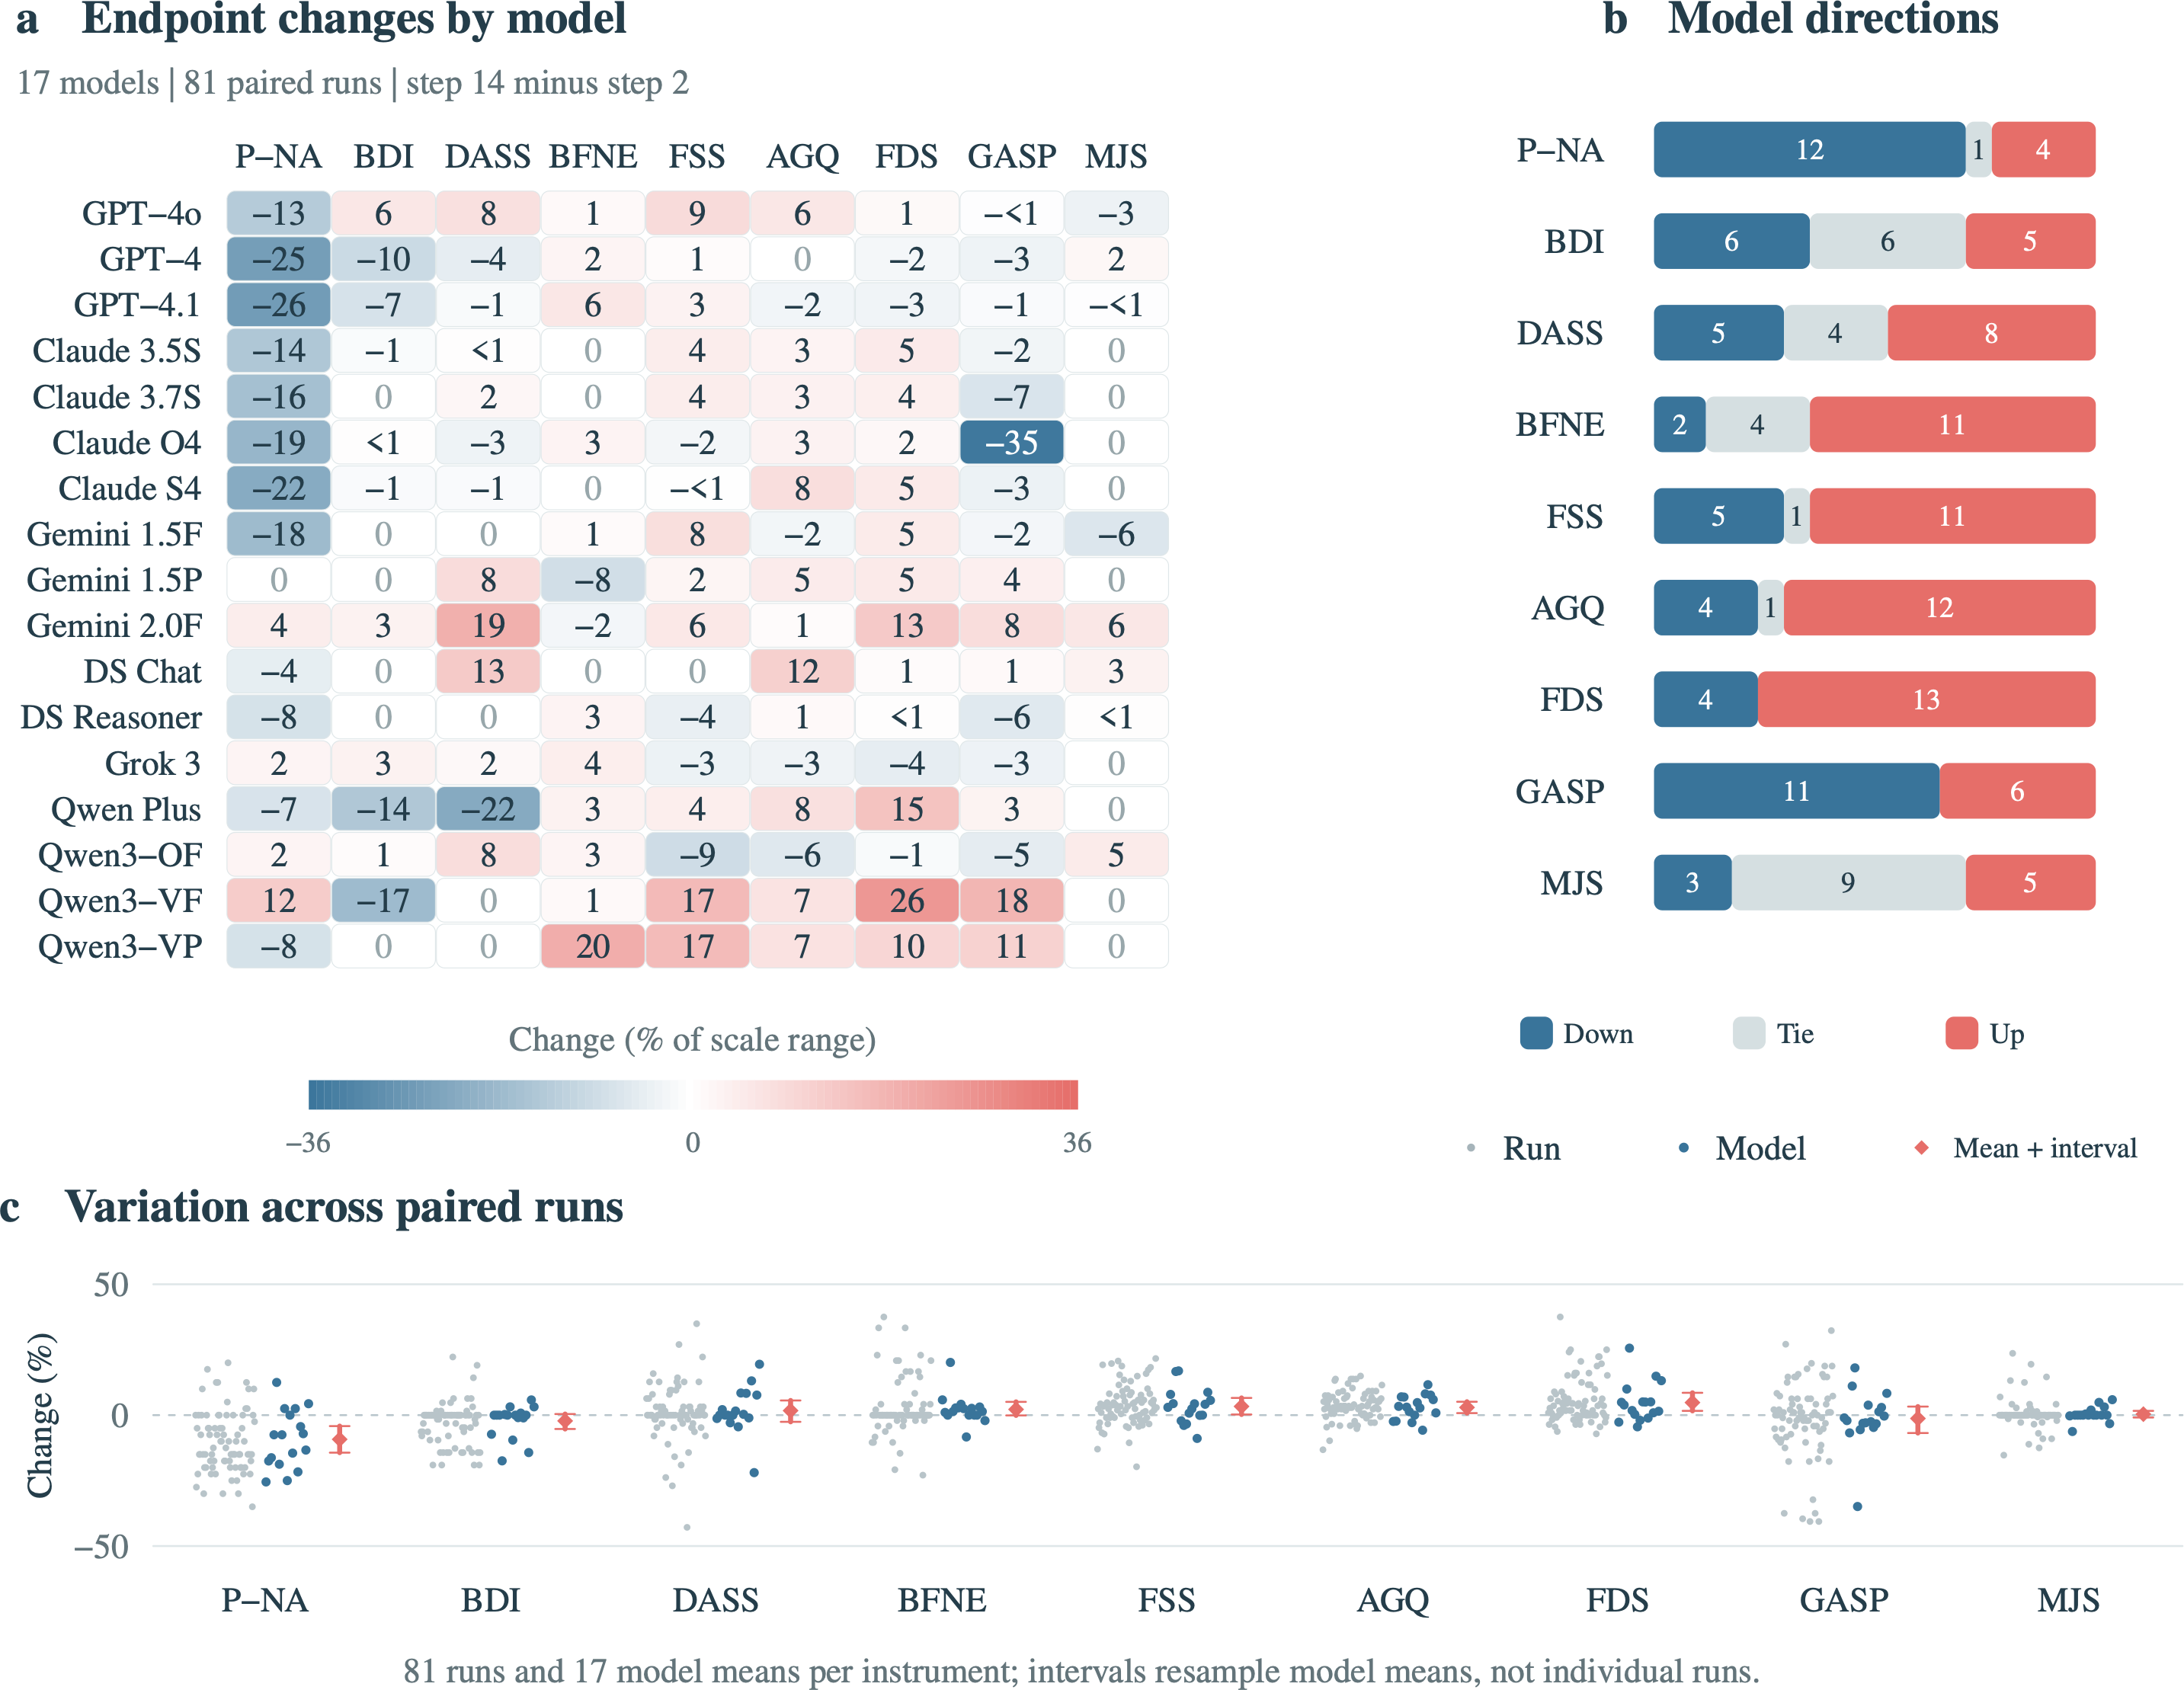
Across 81 endpoint-paired runs from 17 models, PANAS-NA decreases by 3.70 points on average between steps 2 and 14. Both endpoints occur after news exposure has begun, so this contrast is not a pre-exposure versus post-exposure effect.

BDI decreases by 1.38 points on average, with a descriptive interval that includes zero. FSS, AGQ, and FDS instead increase by 6.91, 5.13, and 5.39 points respectively. The full battery does not support one general account of worsening or non-responsiveness.

Forced reading · original results figure

The response depends on both model and instrument.

Enlarge figure
Original three-panel exposure figure: step 14 minus step 2 heatmap for 17 models, counts of model directions, and paired-run/model changes with mean intervals.

Endpoint changes use 17 models and 81 paired runs. Blue indicates a decrease, orange an increase, normalized by instrument range; panel c shows runs, model means, and the equal-model mean with 95% model-resampling intervals.

How to read itBoth endpoints follow exposure onset. These are step-14-minus-step-2 contrasts, not a pre/post exposure causal effect.

PANAS-NA change
−3.70
Step 14 minus step 2; 95% model-resampling interval [−5.73, −1.68].
BDI change
−1.38
Same 81-run endpoint cohort; 95% model-resampling interval [−3.33, 0.26], spanning zero.

03c · Paired channel comparison

The channels disagree on levels and model order.

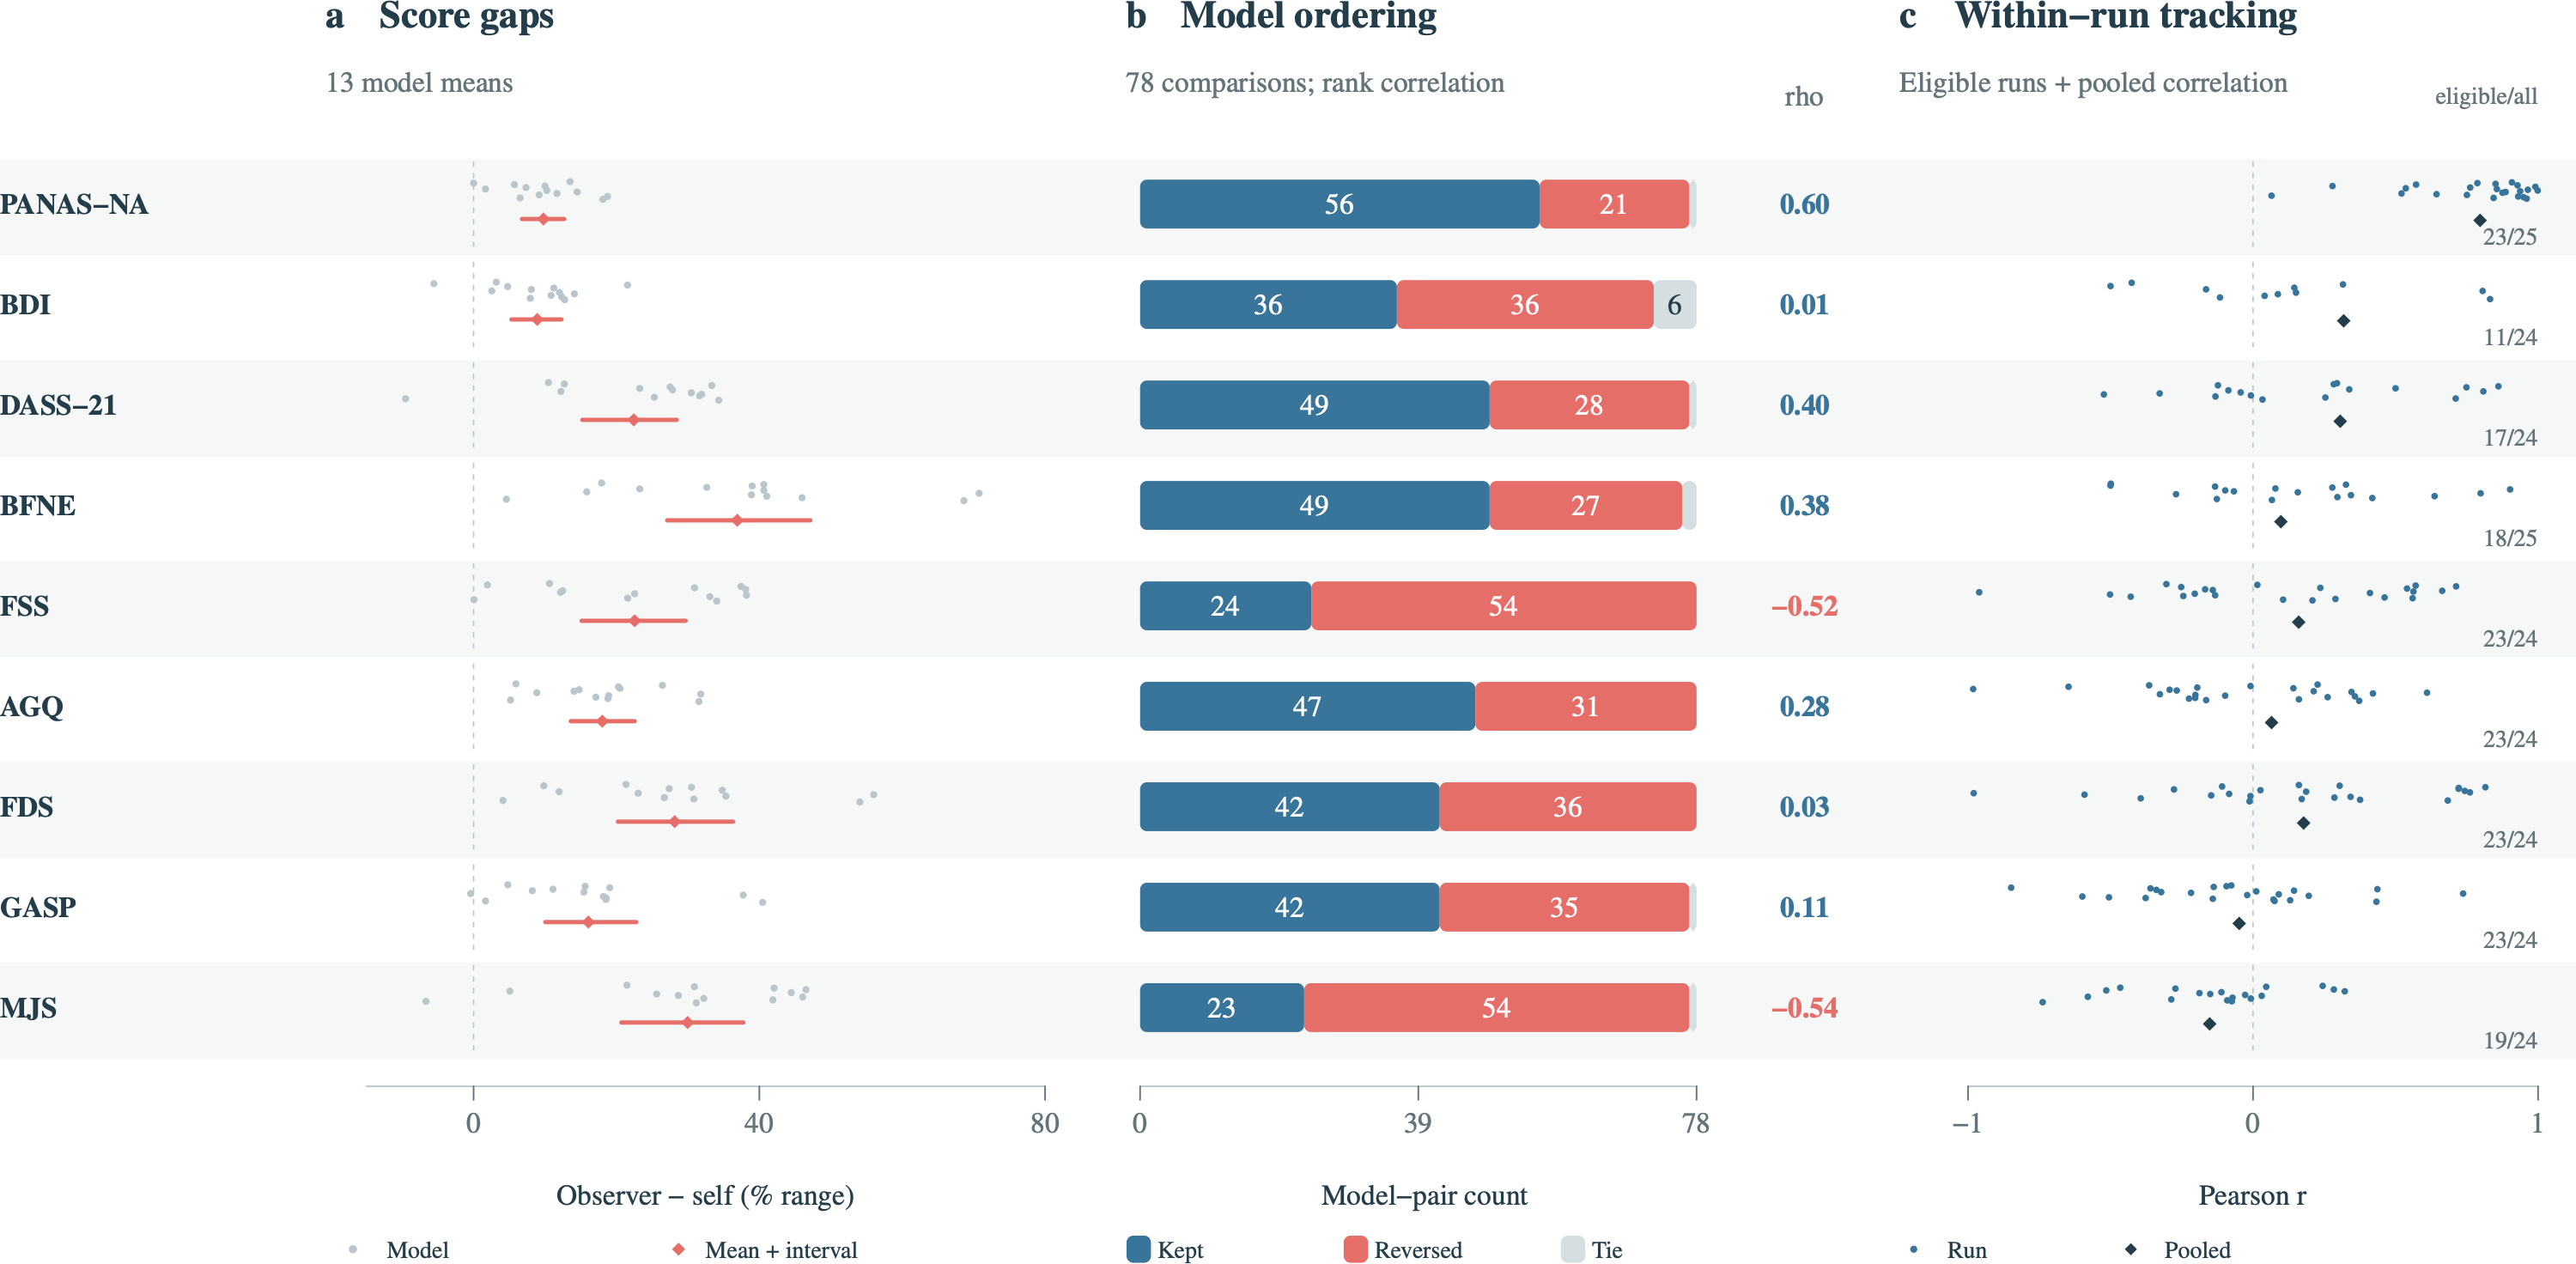
Across 1,882 paired scores from 13 models and 25 runs, all nine model-weighted mean observer-minus-self gaps are positive. Observer scores exceed self scores in 71–99% of individual pairs, depending on the instrument. FSS and AGQ each have only two self-floor pairs, yet their observer scores are higher in over 97% of pairs; floor saturation alone cannot explain the disagreement.

For FSS and MJS, Spearman agreement between the two sets of model means is approximately −0.52 and −0.54. Each instrument reverses 54 of the 78 pairwise orderings among the same 13 models. These ordering counts are descriptive and reuse the same models; they are not independent replications.

Channel agreement · original results figure

Level, ordering and timing are different questions.

Enlarge figure
Original three-panel agreement figure comparing normalized mean channel gaps, Spearman model-order agreement and within-run-centered Pearson correlations.

The figure separates mean level gaps, agreement between 13 model means, and within-run-centered temporal correlations. Each instrument has 205–214 paired scores; the statistics describe distinct measurement properties.

How to read itPANAS-NA can covary over time while scores differ in level. FSS and MJS can disagree on model order. Neither observation chooses a correct channel.

Positive mean channel gaps
9 / 9
Observer minus self, with equal model weights; each instrument has 205–214 paired scores.
Reversed model-pair orderings
54 / 78
Separately for FSS and MJS among 13 models. The channels do not identify which ordering is correct.

03d · Variation and temporal tracking

Structural disagreement can coexist with shared dynamics.

In the common complete cohort of eight models and 14 runs, between-model differences account for 73.8–87.9% of self-report variance on seven instruments, compared with 3.2–12.1% of observer variance. These are shares of each channel’s own total variance. A common shift or rescaling within a channel and instrument preserves those shares.

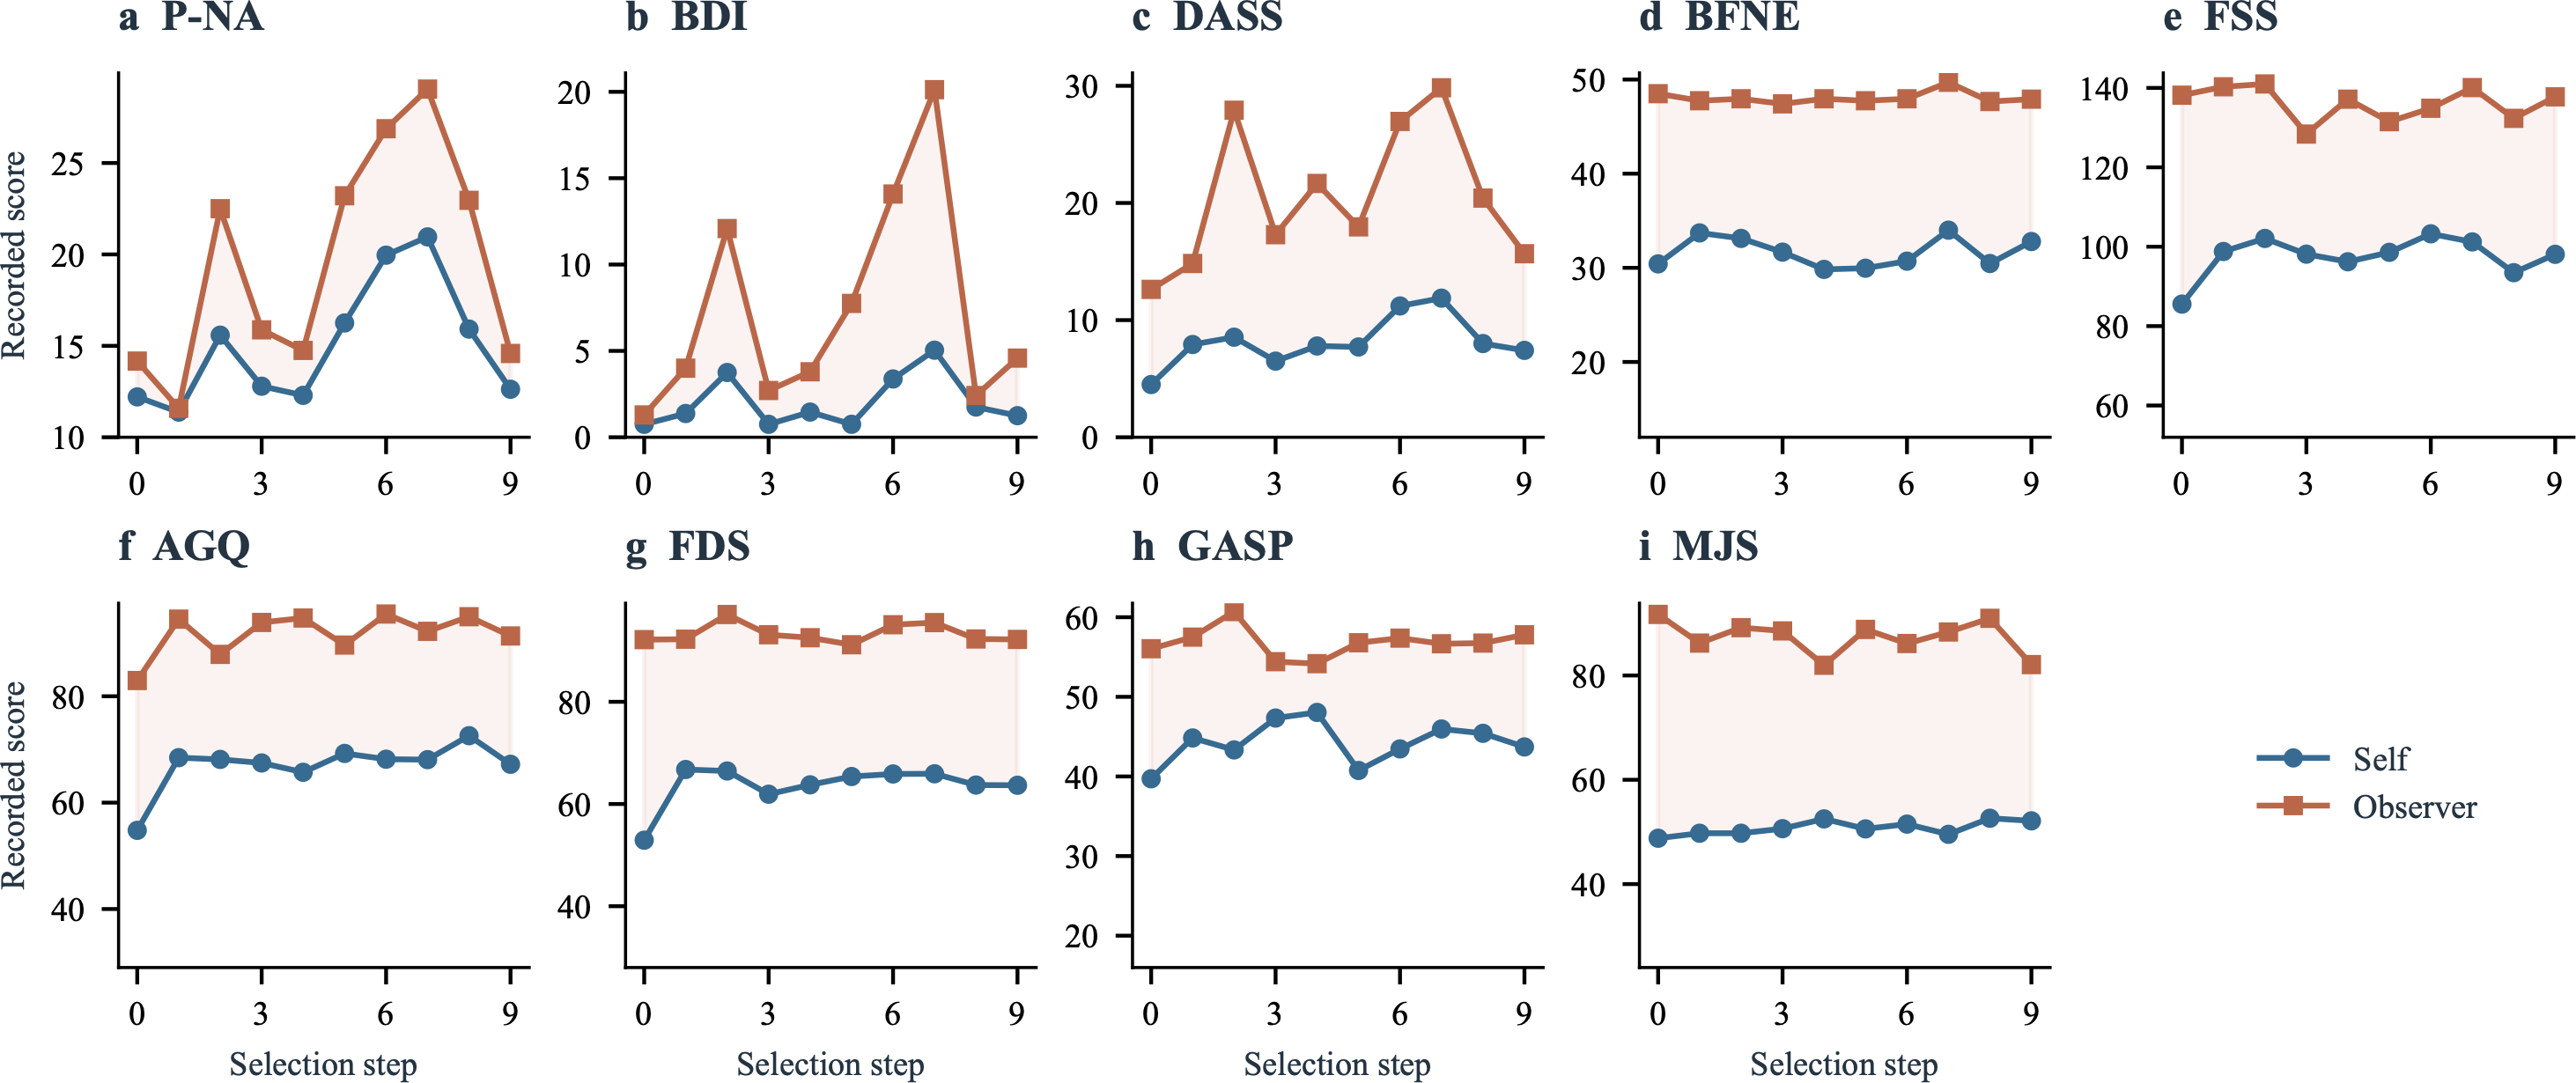
PANAS-NA remains an informative exception: after centering each channel within each run, its pooled correlation is r = 0.80 in the full paired record. All 23 eligible runs have positive within-run correlations. Self-report therefore retains temporal information on this probe despite the level gap; the remaining instruments show weaker temporal agreement.

Common complete cohort · original results figure

Nine instruments, one fixed cohort over time.

Enlarge figure
Original nine-panel time-series figure with self-report and observer assessment over ten steps in eight models and 14 complete runs.

All nine panels use the same eight models and 14 complete runs with equal model weights. Axes retain raw score units and differ across panels. Shading marks channel differences, not confidence intervals.

How to read itCompare the trajectories within each panel. This complete cohort differs from the full paired PANAS-NA record used for the r = 0.80 result below.

Self variance between models
73.8–87.9%
Seven instruments in the 8-model, 14-run complete cohort; observer shares are 3.2–12.1%.
PANAS-NA temporal covariation
r = 0.80
Pooled within-run-centered correlation in all available paired PANAS-NA records; distinct from the complete-cohort analysis.

04 · Interpretation boundaries

What these measurements can support.

The study characterizes the observed scores and interactions under specific assessment procedures. It does not identify an affective truth against which either channel can be certified.

Measurement meaning
The instruments are adapted probes, without validation against human norms for LLM assessment. Scores do not establish clinical diagnoses, subjective experience, stable personality, or depression in a model.
Channel and input provenance
Self-report is a fresh request to the target identifier. Model, instruction, and system prompt change together; the observer is one GPT-4o configuration using the last five messages. Missing historical scoring requests prevent authentication of complete input-message equality.
Coverage and weighting
Coverage is uneven across protocols and instruments. Missing values are not zero; complete cases are selected by coverage. Historical reruns, steps, model pairs, and instruments do not constitute independent replications.
Generalization and causality
Chinese news, fixed menu positions, overlapping non-randomized cohorts, and a single observer limit generalization. Endpoint changes and channel differences do not isolate an exposure effect or a single causal mechanism.

05 · Study information

A public summary of the submitted study.

Full manuscript title: “I'm Fine”: Systematic Cross-Channel Disagreement in LLM Affective Assessment. Research status: submitted to ICLR. This page presents the study’s protocols, selected descriptive findings, and interpretation boundaries.

Explore all research

Choose Details, then scroll horizontally or vertically to explore. Press Escape or close to return.